New Research
New Research Reveals National, State, and Regional Facts about Arts Participation
 Washington, DC—The National Endowment for the Arts is releasing new research that for the first time offers a complete state-by-state perspective on how Americans participate in the arts. In addition, the data reveal that despite decades of declining arts attendance by U.S. adults in the performing and visual arts, more recent rates are holding steady. The new research comes in the form of two “arts data profiles,” NEA collections of statistics, graphics, and summary results from data-mining about the arts. The latest additions are Results from the Annual Arts Basic Survey (2013-2015) and State‐Level Estimates of Arts Participation Patterns.
“The information in these two research profiles adds significantly to our understanding of how adults in this country engage with the arts,” said NEA Chairman Jane Chu. “It is encouraging that participation rates for the performing and visual arts are holding steady while a deeper dive into state participation highlights interesting regional variations that speak to the diversity of our nation.”
Since 1982, the NEA has periodically issued results from the Survey of Public Participation in the Arts (SPPA), a comprehensive survey that has shown significant declines in attendance at performing arts events and at art museums/galleries over long timeframes, particularly between 2002 and 2012.
In addition to referencing the SPPA, the two new profiles include data from the newer Annual Arts Basic Survey (AABS), only in its third year. Although the AABS affords a less detailed perspective than the SPPA, its results are issued more frequently, allowing for more accurate trend-tracking. Trend analysis is useful not only for researchers and the general public to enhance their understanding of how Americans engage with the arts, but also for arts workers who can use the findings to inform their presentation of art to the public.
Arts Data Profile 10: Results from the Annual Arts Basic Survey (2013-2015) includes five research briefs or summary findings from the dataset:
· Visual and Performing Arts Attendance; Movie-Going; Literary Reading; and Learning through Arts Classes or Lessons
· Personal Performance or Creation of Artworks
· Urban/Rural Patterns of Arts Participation
· Gender, Race and Ethnicity, and Age of Arts Participants
· Job Analysis of Arts Participants
Among the key findings from these research briefs are:
Overall Numbers
· In 2015, nearly 32 percent of U.S. adults totaling 76 million people attended a live music, theater, or dance performance over a 12-month period, while 19 percent of adults or 45 million attended an art exhibit. Both of these rates are similar to the share of adults who attended in 2013.
· Despite the rates given above, the AABS shows a drop in the share of adults reading literature. From 47 percent in 2012, literary-reading rates fell to 45 percent in 2013, and to 43.1 percent in 2015.
· Movie-going is the most popular arts activity, with 141 million adults or 58 percent of adults going out to see at least one movie in a year.
· Young adults, ages 18 to 24, tend to participate in the arts at higher rates than adults in general, with 37 percent of young adults attending live performing arts events versus 32 percent of all adults. Relative to their share of the US population, young adults were overrepresented among performing arts attendees by 17 percent.
Personal Creation
· The share of adults who personally perform or create artworks (e.g., play a musical instrument, create visual art, or do creative writing) has remained stable—45 percent in recent years.
· In 2015, just under 3 percent of adults took visual arts classes (e.g., classes in drawing, painting, pottery, or design) while 2.4 percent took classes in music or music appreciation.
· Differences in arts participation rates between adults in urban and in rural communities vary considerably given the concentration of arts venues in cities. However, differences between urban and rural participation rates were negligible when it came to art-making.
Metro Area Analysis
· In an analysis of 11 large metros, Greater Detroit residents were found to attend art exhibitions at a rate of 27 percent, far exceeding the national rate of 19 percent.
· Above-average movie-going is reported in both Chicago and Dallas, while adults performing or practicing dance is popular in the San Francisco and New York metro areas.
· Creative writing is a popular arts pastime in the Greater Boston area. The share of adults writing was 10 percent—about 4 percentage points greater than the national rate.
Occupation
· Visual and performing arts attendees are highly represented by workers in management and professional occupations.
· Among adults who personally perform or create artworks, job categories are distributed in the same pattern as they appear in the U.S. workforce in general.
Arts Data Profile 11: State‐Level Estimates of Arts Participation Patterns features two issue briefs: “Highlights of Arts Participation by State (2012‐2015)” and “Why Some States Exhibit Higher (or Lower) Rates of Arts Participation.”
Among the key findings from the research briefs are:
· Although adults’ state-level rates of arts participation are close to the national average, there are some broad differences.
o Western states tend to have participation rates above average
o Eastern states such as Maryland and Vermont also have above-average rates
o Rates are below average in southern states such as Mississippi, West Virginia and Florida.
o Kansas is one of the few states in the country with an above-average share of adults who use TV, radio, and/or the Internet to consume art or arts programming. In 2012, 71.5 percent of the state’s adults engaged in the arts through media.
· This data profile examines the strength of the relationships among arts participation, education, poverty, and access to arts orgs.
o For the performing arts, the greatest correlations are with education (positive) and poverty (negative). Access to the arts is less of a factor when examining state-level participation.
o The correlation of participation with individuals’ education levels is stronger for visiting art exhibits than for attending the performing arts.

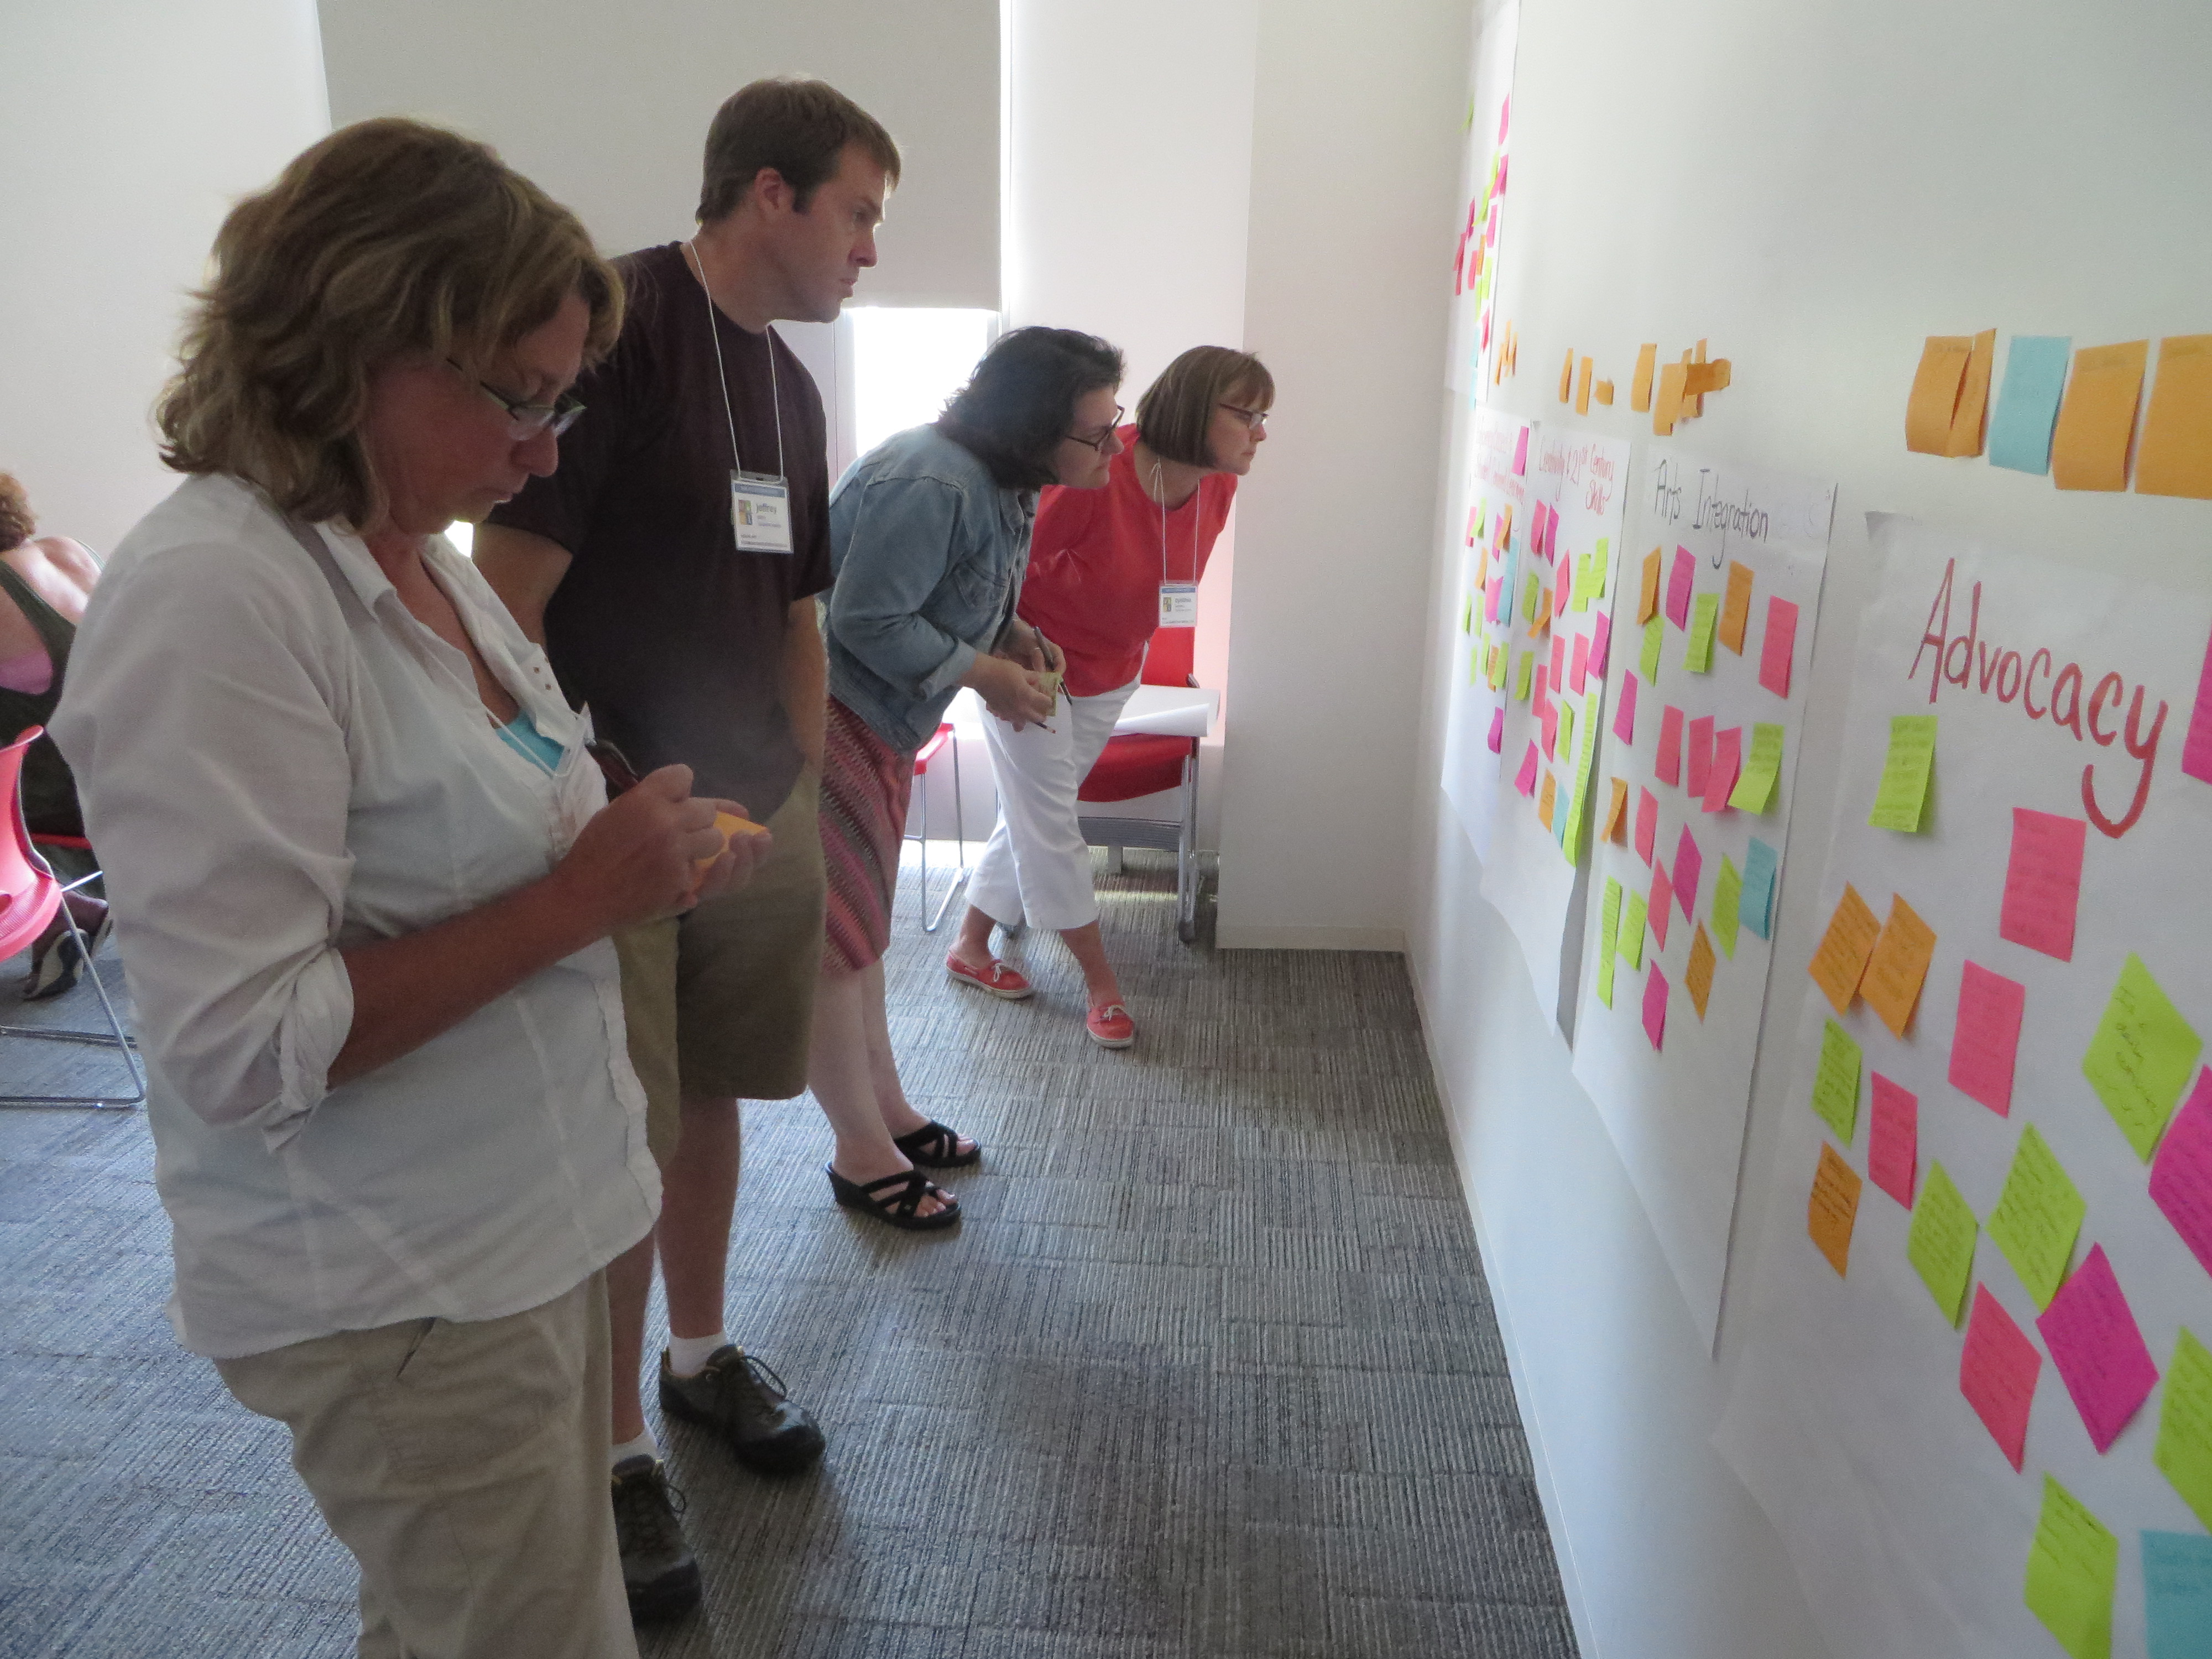
 One educator said: “It is so nice to be able to talk with other arts educators about their views”. Yes, these were all arts educators conversing with other arts educators – the same tribe, our peeps, educators who share a basic understanding about what we contribute in the world. Another participate was grateful to know that “Others are going through the same frustrations as I am”.
  One of my favorite feedback comments of the day is not about assessment or standards or arts skills but about a broader critical piece of what we do: “I learned about helping children to become fearless about making a mistake – mistakes are okay.”
 WHAT QUESTIONS DID PARTICIPANTS HAVE AT THE END OF EACH WORKSHOP?
 Theresa Cerceo
 If you couldn’t join us yesterday some of the workshop leaders provided their resources and they are posted online on the Maine Arts Assessment site. You can access them by

 Theresa Cerceo
 Elise Bothel
  Rob Westerberg
 John Morris
  After four months the deadline for the arts education data collection is coming to a close this Saturday, April 30. The response from schools across the state has been phenomenal. THANK YOU to all those who have helped with the completion of the surveys. With 5 days to go we are closing in on 90%. We’re going to have a ton of data on Maine arts education. YAHOOOO!
 If interested, please send a completed application by the Friday, May 6, 2016, 11:59PM deadline to Argy Nestor at
  Committed to the development of Teacher Leaders to ensure deep understanding and meaningful implementation of high quality teaching, learning and assessment in the Arts for all students.
 Create and implement a statewide plan for teacher leadership in arts education. This includes professional development opportunities, regionally and statewide, which will expand on the knowledge and skills of teachers to better prepare them to teach in a proficiency-based learning environment.
 Seventy – three teacher leaders attended summer institutes on assessment,
 August 3,4,5, 2015: Summer Institute, Portland